Tropical glacier reconstructions during the Last Glacial Maximum in Costa Rica
Adolfo Quesada-Román1,*, Néstor Campos2, and Sebastián Granados-Bolaños1
1 Laboratorio de Geografía Física, Escuela de Geografía, Universidad de Costa Rica,San José, Costa Rica.
2 Laboratorio de Teledetección Ambiental, Departamento de Ciencias Geográficas, Facultad de Ciencias Naturales y Exactas, Universidad de Playa Ancha, Valparaíso, Chile.
* adolfo.quesadaroman@ucr.ac.cr
ABSTRACT
Numerous high elevation tropical mountains around the world show evidence of past glacial activity during the Last Glacial Maximum (LGM). Cerro Chirripó in Costa Rica exhibits paleoglacial landforms such as glacial cirques, moraine deposits and polished and striated bedrock surfaces. We used aerial imagery (1:25000) and contour lines to develop a Digital Elevation Model (DEM) for the LGM. We determined paleo-equilibrium line altitudes (paleo-ELAs) using Area-Altitude Balance Ratio (AABR) during the LGM for Cerro Chirripó in Costa Rica. Additionally, a Generalized Linear Model (GLM) was performed to statistically analyze the paleoglacier volumes and ice thickness combined with ten land surface parameters (LSP). Our results identified thirty-one paleoglaciers covering an area of 28.26 km2 during the global LGM, with a maximum ice thickness of 178 meters in Cerro Chirripó, a total volume of 13863 × 105 m3 and a mean paleo-ELA of 3490 meters. In addition, Area and Slope were the LSP with the highest statistical correlation to explain the paleoglacier volumes, while Area and Diurnal Anisotropic Heating were best for the paleoglacier ice thickness. As one of the first studies in the tropical high mountain environments, this work expands the geographic scope of glacier volume and thickness reconstructions during the maximum expansion of the LGM.
Key words: glacier reconstruction; paleoglacier; ice thickness; equilibrium line altitude; Geomorphometry; Chirripó National Park, Costa Rica.
RESUMEN
Numerosas altas montañas tropicales muestran evidencia de actividad glacial durante el Último Máximo Glacial (UMG) y han sido documentadas alrededor del mundo. El Cerro Chirripó, en Costa Rica, presenta formas de relieve paleoglaciares como circos glaciares, depósitos de morrenas, así como superficies de roca pulida y estriada. Utilizamos imágenes aéreas (1:25000) y curvas de nivel para obtener un Modelo Digital de Elevación (MDE) del UMG. Determinamos las altitudes de las líneas de paleoequilibrio (paleo-ELAs) usando el Area-Altitude Balance Ratio (AABR) durante el UMG para el Cerro Chirripó en Costa Rica. Además, se realizó un Modelo Lineal Generalizado (MLG) para analizar estadísticamente los volúmenes de los paleoglaciares y el espesor del hielo combinados con diez parámetros de superficie terrestre (PST). Nuestros resultados determinaron treinta y un paleoglaciares que cubrían un área de 28.26 km2 durante el UMG global, con un espesor máximo de hielo de 178 metros en el Cerro Chirripó, un volumen total de 13863 × 105 m3 y un paleo-ELA medio de 3490 metros. Además, Área y Pendiente fueron los PST con mayor correlación estadística para explicar los volúmenes paleoglaciares, mientras que Área y Calentamiento Anisotrópico Diurno (CAD) fueron los mejores parámetros para el espesor del hielo paleoglaciar. Como uno de los primeros estudios en los ambientes tropicales de alta montaña, este trabajo expande el alcance geográfico de las reconstrucciones de glaciares durante la máxima expansión del UMG.
Palabras clave: reconstrucción glaciar; paleoglaciar; grosor de hielo; altitud de la línea de equilibrio; Geomorfometría; Parque Nacional Chirripó, Costa Rica.
Manuscript received: september 28, 2020
Corrected manuscript received: january 25, 2021
Manuscript accepted: january 28, 2021
INTRODUCTION
Glacier reconstructions as a paleoclimatic information source has an important role in analyzing the relationships between glaciers and climate (Campos et al., 2019). Interpretations of glacial relict landforms can be used to deduce climatic conditions at the time of glaciation, implying that prior glaciers may be useful paleoclimatic proxy records (Carr and Coleman, 2007). In addition, glacial reconstructions can provide crucial information about past glacial changes over much longer timescales than the observational record permits (Carr et al., 2010; Pearce et al., 2017). Moreover, tropical glaciers are highly sensitive to changes in regional and global climate (Chen et al., 2018). Glacial landforms associated with the Last Glacial Maximum (LGM; between ~26.5–19 ka as defined by Clark et al., 2009) persist in tropical regions of Africa, Asia, Oceania, and America (Porter, 2000; Mark et al., 2005). In America, several tropical regions in Costa Rica, Guatemala, Mexico, and the Andes have reported glacial relict landforms created during the LGM (Palacios et al., 2020).
In Costa Rica, Cerro Chirripó’s past glacial dynamics have been studied several times (Weyl, 1955; Hastenrath, 1973; Bergoeing, 1977; Barquero and Ellenberg, 1983). Lachniet and Seltzer (2002) mapped 35 km2 of the Cerro Chirripó area and mentioned that the local equilibrium line altitude (ELA) was located at 3500 m a.s.l. More recently, the glacial geomorphology of the Chirripó National Park was described in more detail even expanding previous mapped areas (Li et al., 2019; Quesada-Román and Zamorano-Orozco, 2019a). Earlier works suggest paleo-ELAs between 3500 and 3550 m a.s.l. and a mean temperature ranging from 6 to 8 °C colder than the present during the LGM (Islebe and Hooghiemstra, 1997; Orvis and Horn, 2000; Lachniet and Roy, 2011). Moraine sequences have been dated using 10Be and 36Cl cosmic ray exposure (CRE), confirming a peak development period between 21–18 ka BP (Cunningham et al., 2019; Potter et al., 2019). Recently, Quesada-Román et al. (2020c) determined an average paleo-ELA around 3490 m a.s.l. for 31 paleoglaciers during the LGM, and obtained paleotemperatures even 10 °C lower than today.
Glacial geomorphological mapping provides parameters to constrain and test numerical simulations of alpine ice masses, such as cirque glaciers or valley glaciers (Chandler et al., 2018). Recently, Quesada-Román et al. (2019) performed a detailed glacial and periglacial mapping of Cerro Chirripó that showed a detailed distribution of lateral moraines, which illustrated the maximum probable extent of glaciers during the LGM. With the presently available high-resolution digital information, geomorphometric assessments can revolutionize the way paleogeography is analyzed (Sofia, 2020). Despite the existence of several glacial geomorphology studies in Cerro Chirripó and Chirripó National Park since the 1950s, there are no studies aimed at estimating the volumes and thicknesses paleoglaciers or at understanding the variables that controlled their response during the LGM. We hypothesize that glacial development during the LGM in the highest mountains of Costa Rica was conditioned by global and regional climatic variability and locally by topographic control. As far as we know, this work is one of the first studies of paleoglacial volume and ice thickness reconstruction in the tropics. Therefore, our aims are to (i) reconstruct the volume and the ice thickness distribution of the Chirripó paleoglacial system and, (ii) to make a Generalized Linear Model using ten land surface parameters to explain the paleoglacial volumes and ice thickness.
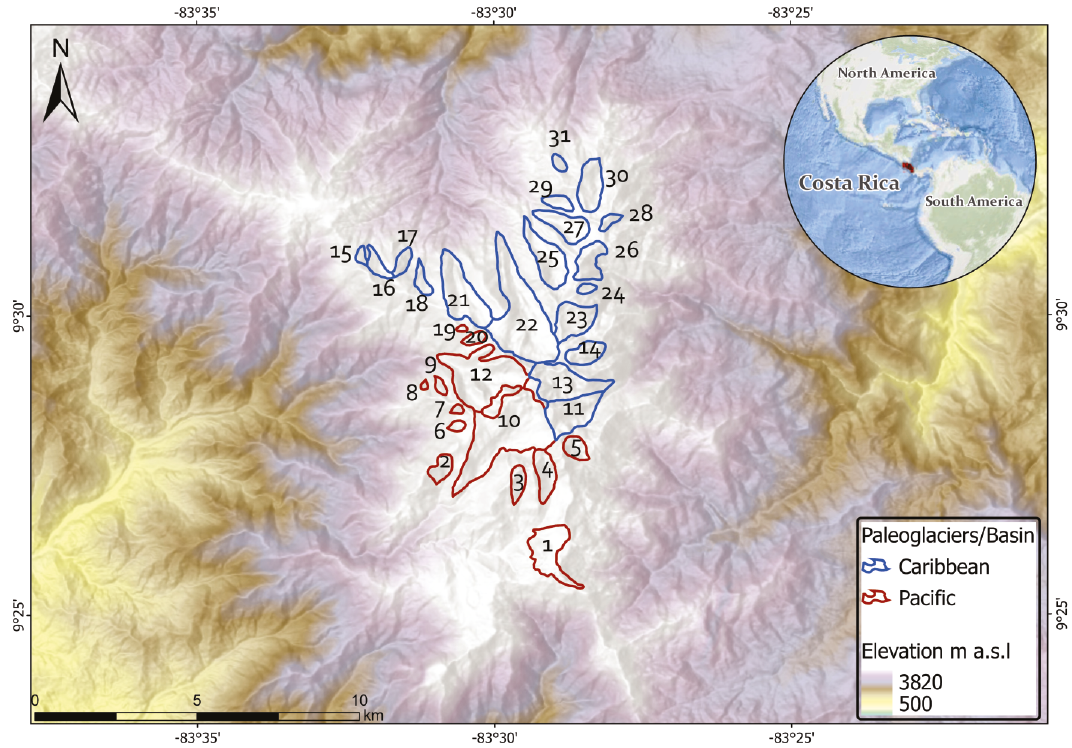
Figure 1. Chirripó National Park location and reconstructed paleoglaciers: 1) Cerro Amó; 2) Los Arrepentidos; 3) Cerro Terbi 1; 4) Cerro Terbi 2; 5) Pico Sureste; 6) Bosin; 7) Cerro Ventisqueros 1; 8) Cerro Ventisqueros 2; 9) Cerro Ventisqueros 3; 10) Valle Talari; 11) Pico Noreste; 12) Lagos Chirripó; 13) Cerro Pirámide; 14) Cerro Truncado; 15) Cerro Urán 1; 16) Cerro Urán 2; 17) Cerro Urán 3; 18) Cerro Urán 4; 19) Río Chirripó Pacífico 1; 20) Río Chirripó Pacífico 2; 21) Río Chirripó; 22) Valle Las Morrenas; 23) Cerro Laguna; 24) Chirripó Grande 1; 25) Chirripó Grande 2; 26) Chirripó Grande 3; 27) Fila Norte 1; 28) Fila Norte 2; 29) Fila Norte 3; 30) Fila Norte 4; 31) Fila Norte 5. Glaciers named by Quesada-Román et al. (2020c).
GEOGRAPHICAL SETTING
Cerro Chirripó is the highest peak in Costa Rica with a summit at 3820 m.a.s.l. It is situated within the Chirripó National Park, which is part of the Cordillera de Talamanca (Figure 1). The highlands of the Chirripó National Park are the product of the subduction processes of the Cocos and Caribbean plates with influences from regional volcanism and seismicity (e.g., DeMets et al., 2010). The impact of the Cocos Ridge on SE Costa Rica, an arrangement of oceanic crust originating from the Galapagos hotspot, caused uplift of the Cordillera de Talamanca. Volcanism in the Cordillera de Talamanca ceased approximately 2 Ma ago (Morell et al., 2012). The predominant lithology of the Cordillera is composed of three phases: 1) Vulcanism before the upper Miocene, about 17 to 11 Ma ago; 2) Plutonism during the middle-upper Miocene, between 12.5 and 7.5 million years ago, known as the Talamanca Intrusive Group or Talamanca Granite-Gabbro; 3) Post-intrusive magmatic pulses from the Neogene to the Quaternary, whose time range extends between 5 and 2 million years (Alfaro et al., 2018). Regional tectonics are controlled by extreme uplift rates oscillating from 1.7 to 8.5 m/ka (Gardner et al., 2013; Quesada-Román and Zamorano-Orozco, 2019b), as well as faulting with NW-SE and N-S alignments (Camacho et al., 2020). Volcanic slopes molded by glacial or periglacial activity comprise the paleo-glaciated highlands (Quesada-Román and Zamorano-Orozco, 2019b). The remains of these processes include cirques, moraines, till deposits, arêtes, and glacial lakes over 3000 m a.s.l. (Quesada-Román et al., 2019). Currently the summits of Chirripó National Park are not glaciated.
The latitudinal movement of the Intertropical Convergence Zone (ITCZ), trade winds, cold fronts, and tropical cyclones (Alfaro et al., 2010; Campos-Durán and Quesada-Román, 2017) control the climatic conditions of the high Costa Rican mountains. These processes favor two rainfall peaks, one in May and another in October accumulating around 1800 mm of rain annually. These are intermittent with a minimum in July and August known as the Mid-Summer Drought (Maldonado et al., 2016), however, the dry season generally occurs from December to April with average temperatures of 9.7 °C (Figure 2; Quesada-Román 2016, 2017). The temporal and spatial variability of rainfall in the country is heavily influenced by the El Niño-Southern Oscillation (ENSO; Méndez et al., 2019; Quesada-Román and Pérez-Briceño, 2019). According to Waylen and Laporte (1999), complex and contrasting responses (i.e., warm or wet) vary in terms of their signs, magnitude, duration, and seasonality between catchment areas draining to the Pacific and those flowing into the Caribbean Seas. At present, páramo, a grass and/or shrub dominated ecosystem in the neotropics, dominate the Costa Rican highlands over 3100 m a.s.l., providing important hydrological and ecological functions (Esquivel-Hernández et al., 2018; Quesada-Román et al., 2020a). This ecosystem is threatened by projected warming conditions in the following decades (Veas-Ayala et al., 2018). Recently, a dendrochronological study reported the ENSO signal in a páramo endemic shrub of Chirripó National Park (Quesada-Román et al., 2020b).
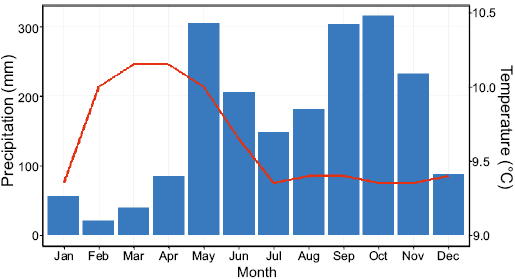
Figure 2. Average precipitation and temperature conditions of Chirripó National Park between 1995 and 2009 (IMN, 2009; Veas-Ayala et al., 2018).
METHODS
Paleoglacier reconstruction
We created a digital elevation model (DEM) using a Geographic Information System (ArcGIS 10.3) (Table 1) to allow calculation of glacial volumes. The DEM was obtained by subtracting the actual DEM of the area, created from contour lines with 10 m interval provided by CARTA - Costa Rica Airborne Research and Technology Applications (2005). Quesada-Román et al. (2020c) transformed the lines from the LGM based on previous studies (Lachniet and Seltzer, 2002; Lachniet and Vázquez-Selem, 2005). In order to obtain the LGM DEM, the contour lines were converted into a triangulated irregular network (TIN) and transformed into a raster. Due to a lack of high-resolution sources, a by-product of the difficult access to the area, the calculations have been made with the best topographic information existing for the region. Therefore, the reconstruction, although it shows reasonable and logical results considering the current topography, is bound to a number of uncertainties and should be considered with this in mind. The new DEM allowed us to calculate the volume of each glacier. The limits of the paleoglaciers were obtained by Quesada-Román et al. (2020c) on the basis of the limits proposed by Lachniet and Seltzer (2002). Table 1 shows the ELA values for each glacier. We used the values obtained by Quesada-Román et al. (2020c) using the Area-Altitude Balance Ratio (AABR) method, which considers the hypsometry of the glacier, with BR=2. This method assumes that the mass balance gradient consists of approximately two linear segments, normally with different slopes above and below the ELA, and uses a balance ratio (BR) for the estimate (Osmaston, 2005). We chose BR=2 because tropical glaciers had high ablation ratios and tend to have small ablation areas (Rea, 2009).
Morphometric and statistical analysis
First, we calculated and extracted the mean value of seven land surface parameters (LSP) for each paleoglacier. We considered Area (A), Basin location (B), Analytical Hillshading (AH; Tarini et al., 2006), Aspect (ASP), Area Surface Radiation (ASR; Boehner and Antonic, 2009), Diurnal Anisotropic Heating (DAH; Cristea et al., 2017), Slope (SLO), Terrain Ruggedness Index (TRI; Riley et al., 1999), and Wind Exposition (WE; Boehner and Antonic, 2009) using SAGA software (Conrad et al., 2015). Second, we applied a Pearson correlation equation (Vinod, 2017), and performed a generalized linear model (GLM) to describe statistically significant linkages between obtained paleoglacier volumes (VOLUME) as well as paleoglacier ice thickness (ICE) with LSP. Based on the Akaike Information Criterion (AIC) (Anderson and Burnham, 2004), we used a backward selection to contrast the two models (VOLUME/ICE~ AREA+B+AH+ASP+ASR+DAH+SLO+TRI+WE) against the alternative model (VOLUME~ AREA+SLOPE) and (ICE~ AREA+DAH). All co-variables were first standardized using z-score (regression coefficient divided by standard error). Finally, model parameters were used to evaluate the weight of each LSP interaction explaining the paleoglacier volumes and ice thickness.
Table 1. Summary of the spatial measurements of the studied paleoglaciers. Length, altitude and equilibrium line altitude (ELA) data taken from Quesada-Román et al. (2020c). AABR: Area-Altitude Balance Ratio method.
|
Number |
Glacier |
Basin |
Length (m) |
Area (km2) |
Altitude (m a.s.l.) |
ELA AABR |
Volume+ (× 105 m3) |
Max. ice thickness (m) |
|
|
Max |
Min |
(2.0) |
|||||||
|
1 |
Cerro Amó |
Pacific |
2340 |
1.488 |
3410 |
3295 |
3389 |
137.043 |
53.37 |
|
2 |
Los Arrepentidos |
Pacific |
985 |
0.413 |
3524 |
3195 |
3326 |
11.564 |
25.43 |
|
3 |
Cerro Terbi 1 |
Pacific |
1238 |
0.400 |
3700 |
3397 |
3580 |
113.563 |
58.36 |
|
4 |
Cerro Terbi 2 |
Pacific |
1710 |
0.759 |
3610 |
3393 |
3502 |
189.212 |
81.65 |
|
5 |
Pico Sureste |
Pacific |
945 |
0.418 |
3573 |
3360 |
3499 |
94.322 |
52.94 |
|
6 |
Bosin |
Pacific |
580 |
0.129 |
3680 |
3579 |
3652 |
8.948 |
12.85 |
|
7 |
Cerro Ventisqueros 1 |
Pacific |
404 |
0.081 |
3696 |
3585 |
3679 |
4.575 |
16.6 |
|
8 |
Cerro Ventisqueros 2 |
Pacific |
300 |
0.045 |
3556 |
3293 |
3411 |
10.548 |
38.28 |
|
9 |
Cerro Ventisqueros 3 |
Pacific |
680 |
0.134 |
3683 |
3535 |
3583 |
40.689 |
63.17 |
|
10 |
Valle Talari |
Pacific |
4050 |
4.333 |
3700 |
3198 |
3560 |
2736.606 |
144.3 |
|
11 |
Pico Noreste |
Caribbean |
1970 |
1.449 |
3661 |
3265 |
3478 |
1375.641 |
178.14 |
|
12 |
Lagos Chirripó |
Pacific |
2850 |
2.885 |
3740 |
3162 |
3590 |
1852.853 |
150.36 |
|
13 |
Cerro Pirámide |
Caribbean |
2695 |
1.778 |
3705 |
3148 |
3530 |
501.224 |
91.82 |
|
14 |
Cerro Truncado |
Caribbean |
1302 |
0.631 |
3689 |
3365 |
3542 |
248.840 |
87.21 |
|
15 |
Cerro Urán 1 |
Caribbean |
584 |
0.137 |
3495 |
3231 |
3380 |
75.902 |
63.89 |
|
16 |
Cerro Urán 2 |
Caribbean |
1225 |
0.361 |
3495 |
3222 |
3419 |
125.335 |
70.12 |
|
17 |
Cerro Urán 3 |
Caribbean |
1005 |
0.298 |
3469 |
3134 |
3251 |
184.515 |
107.34 |
|
18 |
Cerro Urán 4 |
Caribbean |
1165 |
0.295 |
3532 |
3306 |
3408 |
53.905 |
47.03 |
|
19 |
Río Chirripó Pacífico 1 |
Pacific |
355 |
0.049 |
3696 |
3603 |
3665 |
9.837 |
no data |
|
20 |
Río Chirripó Pacífico 2 |
Pacific |
790 |
0.208 |
3698 |
3584 |
3633 |
26.167 |
31.56 |
|
21 |
Río Chirripó |
Caribbean |
2808 |
1.942 |
3700 |
3240 |
3545 |
893.577 |
102.63 |
|
22 |
Valle Las Morrenas |
Caribbean |
4255 |
4.083 |
3700 |
3132 |
3539 |
2919.562 |
163.96 |
|
23 |
Cerro Laguna |
Caribbean |
1450 |
1.100 |
3653 |
3370 |
3535 |
603.031 |
126.52 |
|
24 |
Chirripó Grande 1 |
Caribbean |
630 |
0.137 |
3597 |
3491 |
3517 |
27.569 |
48.38 |
|
25 |
Chirripó Grande 2 |
Caribbean |
2545 |
1.350 |
3650 |
3251 |
3515 |
788.173 |
121.54 |
|
26 |
Chirripó Grande 3 |
Caribbean |
640 |
0.773 |
3514 |
3293 |
3394 |
137.116 |
54.1 |
|
27 |
Fila Norte 1 |
Caribbean |
1835 |
0.942 |
3525 |
3248 |
3440 |
215.016 |
93.02 |
|
28 |
Fila Norte 2 |
Caribbean |
870 |
0.191 |
3530 |
3354 |
3499 |
56.604 |
62.53 |
|
29 |
Fila Norte 3 |
Caribbean |
1040 |
0.307 |
3491 |
3275 |
3377 |
10.751 |
14.15 |
|
30 |
Fila Norte 4 |
Caribbean |
1730 |
0.976 |
3576 |
3307 |
3439 |
379.673 |
74.6 |
|
31 |
Fila Norte 5 |
Caribbean |
625 |
0.165 |
3500 |
3369 |
3393 |
30.408 |
66.97 |
RESULTS
Glacier reconstruction
The 31 reconstructed paleoglacier volumes yield a total of 13862.76 × 105 m3 (Table 1). Nonetheless, paleoglacier average volumes were restricted to 447.18 × 10⁵ m3. The Caribbean basin comprised 62 % of the total volumes, but the distribution of large volumes was located in both basins (Figure 1). Ice thickness varied from 12.85 m to 178.14 m (Table 1; Figure 3), however, ice thickness during the LGM in the highest mountains of Costa Rica had an average thickness of 76.76 m, which was greater in the Caribbean (87.44) than in the Pacific basin (60.73). The bigger paleoglacier volumes and some of the highest ice thickness values were reported in Lagos Chirripó (Figure 4b) and Valle Talari (Figure 4d) of the Pacific basin, and Valle Las Morrenas in the Caribbean basin (Figure 4c).
Land surface parameters analysis
Statistical analyses of the paleoglacier volumes with LSP based on the AIC criterion supports the null model (AIC=435.51) against the alternative model (AIC=429.55). In addition, the model suggests that the best generalized linear model supports an interaction between Area and Slope (VOLUME ~AREA+SLOPE). Table 2 provides the model parameters, also indicating that the most significant influence on onset probability of paleoglacier volumes are provided by Area and Slope, as shown by z-ratio tests of parameter estimates.
The most influential LSP according to the GLM that show interesting associations were Area and Slope. The glaciers of the Caribbean represent 58 % of the total number of glaciers and 60 % of the entire glacial area (Table 1). Larger paleoglacier volumes and areas were encountered mainly in the Caribbean basin. With the exception of three cases, Pacific paleoglacier volumes tended to be below 0.5 km2 (Figure 5a). The majority of Slope values are less than 1000 m3. Larger paleoglacier volumes (1500–3000 m3), two in each basin, were located on slopes between approximately 15 and 30 slope degrees (Figure 5b). Topographic conditions such as the marked relationship of Area and Slope probably regulated climate responses in Cerro Chirripó. The Caribbean basin has steeper slopes and smaller paleoglaciers while the Pacific basin presented larger paleoglacier volumes.
Morphometric statistical analyses of the determined paleoglacier ice thicknesses (ICE) based on the AIC criterion supports the alternative model (AIC=291.77) against the null model (AIC=293.58). The model suggests that the best generalized linear model supports an interaction between Area and DAH (ICE ~AREA+DAH). Table 3 provides the model parameters, also indicating that the most significant influence on onset probability of paleo-glacier ice thickness are given by Area and DAH, as shown by z-ratio tests of parameter estimates.
The most statistically significant paleoglacier land surface parameters were Area and DAH. Ice thickness values of 80 % of the glaciers were between 12.85 and 107.34 m, with a maximum height of 178.14 m.
Even so, there was a slight trend of broader paleoglaciers in the Caribbean basin (Figure 5c). Another LSP with a strong statistical relationship to explain the paleoglacier ice thickness of Cerro Chirripó was DAH. This index shows the spatial terrain variation as a function of slope and aspect. Both basin’s paleoglaciers had flatter slopes. The Pacific basin paleoglacier aspects tended more to the SW (-0.2 to 0.3) with ice thickness around 10 and 150 m, while the Caribbean paleoglaciers had an eastern orientation and thicker ice (Figure 5d). The greater thickness of Caribbean basin paleoglaciers could be related to differential warming due to dissimilar slope aspects that produced asymmetric topographic heat budget distributions. This likely exerted the principal control on glacier ice thickness during the LGM.
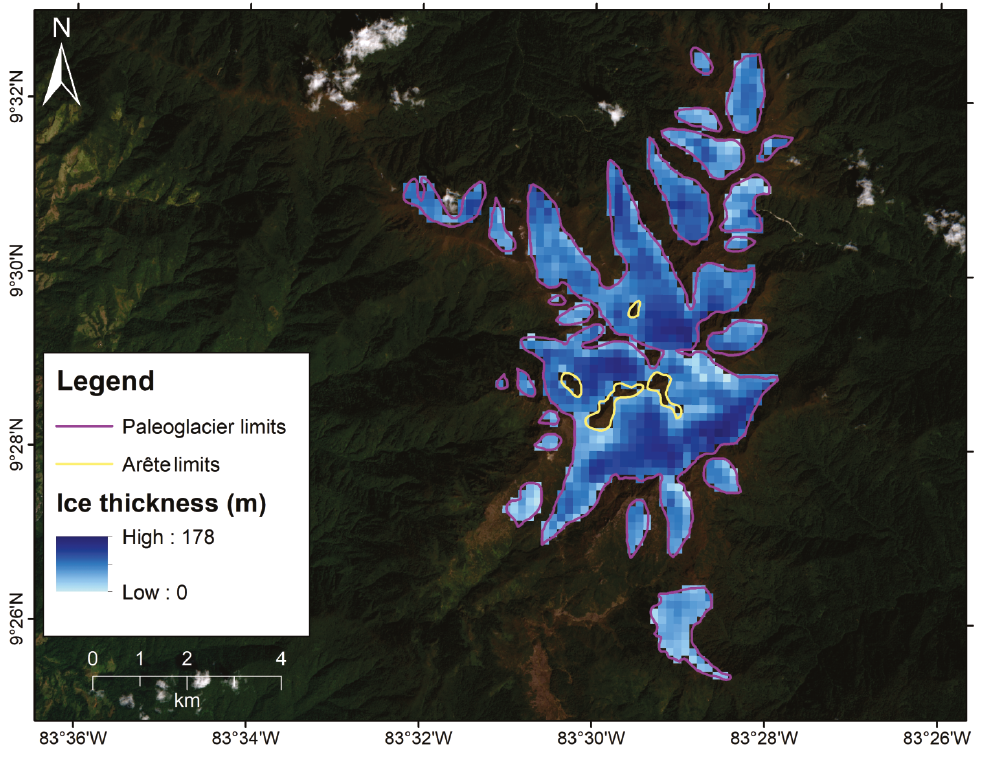
Figure 3. Reconstruction and distribution of the ice thickness (m).
DISCUSSION
We performed the Chirripó paleoglacier system reconstruction, which determined its volumes, ice thickness distributions and significant land surface parameter analyses using its ELA with the AABR method during the LGM. We focused upon 31 paleoglaciers summing up a total area of 28.2 km2 at 1:25000 scale. This result agrees with Quesada-Román et al. (2019) who determined 29.7 km2 of landscapes impacted by ice masses and 51.6 km2 of periglacial processes using 1:25000 aerial imagery. Other studies with less resolution (1:50000 aerial photos or 30 m spaceborne imagery) reported 35 km2 (Lachniet and Seltzer, 2002), and 22.1 km2 (Li et al., 2019) of glacial areas around the Cerro Chirripó area. The results showed that the paleo-ELA based on the AABR (2.0) method for Cerro Chirripó is ~3490 m a.s.l, which is likely similar to previous paleo-ELA reconstructions in Costa Rica, Guatemala, and Venezuela (Lachniet and Seltzer, 2002; Lachniet and Vázquez-Selem, 2005; Stansell et al., 2007; Roy and Lachniet, 2010; Lachniet and Roy, 2011). Quesada-Román et al. (2020c) calculated a LGM paleotemperature ~10 °C lower than today in Chirripó National Park, which is consistent with reconstructions in Guatemala, Mexican volcanoes, and Venezuela (Stansell et al., 2007; Roy and Lachniet, 2010; Vázquez-Selem and Lachniet, 2017). Moreover, Mexican speleothem reconstructions and magnetic susceptibility measurements suggested wet conditions in the Pacific and Atlantic coasts of Central America during the LGM due to a Mesoamerican monsoon establishment motivated by a ITCZ proximal to Mexico (Hodell et al., 2008; Lachniet et al., 2009; Escobar et al., 2012; Lachniet et al., 2013; Oster et al., 2019). These wet and cold conditions prevailed in the circum-Caribbean region during the LGM and agreed with global sea surface temperature reconstructions (Ganeshram et al., 2000; Annan and Hargreaves, 2015).
During the LGM, tropical American paleoglaciers descended below 4000 m. In other tropical and subtropical latitudes on different continents, several other glaciated mountains have been reported in Oceania with Mt. Wilhelm, Star Mts, and Mt. Giluwe in Papua New Guinea (3400–3600 m); Asia in Taiwan Shan, Taiwan (3450 m), Mt Kinabulu in Malaysia (3665 m), and Mt Jaya in Indonesia (3590 m). This has also been noted in Africa in Ayachi and Toubkalin in Morocco (3250-3450 m), Aberdare in Kenya (3600 m), Mt Kecha in Ethiopia (3600 m), as well as in Elgon N and numerous mountains in Uganda (~3500 m) (Porter, 2001; Mark et al., 2005; Osmaston and Harrison, 2005). It must be noted that cooling during the LGM was amplified by elevation and hence the lapse rate was significantly steeper than today (Loomis et al., 2017). Different studies indicate that the retreat of tropical glaciers was synchronous or even earlier than that seen in temperate latitudes (Clark et al., 2009). Recently, Jackson et al. (2019) found that tropical glacial recession was ongoing by 20 ka, preceding the rapid CO2 rise at ~18.2 ka influenced by rising high-latitude insolation and parallel with the ice-sheet recession in both polar regions.
Most studies of tropical glacier volumes in South America focus on modern glaciers, since the relevance of the glaciers located in the tropics to society is primarily reflected in their provision of water supplies in parts of South America, mainly during the dry season (Mölg et al., 2008). According to Favier et al. (2004) tropical climate is characterized by homogeneous temperature conditions during the year, with a slight seasonality of air temperature in the outer tropics (higher temperatures during the austral wet summer). However, we can deduce the similarities with other tropical glaciers by looking at the altitude of the moraines. In Chirripó National Park, the frontal moraines from the LGM are located at an average altitude of ~3295 m a.s.l. Our result is comparable with other studies of tropical glaciers during the LGM in regions such as in Mexico, South America along the Andes, East Africa, Indonesia and Papua New Guinea (Mark et al., 2005).
Costa Rica highland paleoglacier volumes and ice thickness during the LGM were controlled by local land surface parameters. Topographic conditions regulate climate responses in the Chirripó National Park. Its climate is defined by the interaction of the Intertropical Convergence Zone migration, north-east trade winds, cold fronts, and tropical cyclones (Esquivel-Hernández et al., 2019). Recently, Quesada-Román et al. (2020c) reported that Wind Exposition and Terrain Ruggedness Index were the LSPs with significant statistical relationships with the paleoglacier areas. Our results demonstrated other LSP that explain the paleoglacier volumes and thickness reconstructions. Area and Slope showed a significant statistical relationship with the paleoglacial volumes, while Area and Diurnal Anisotropic Heating are responsible for paleoglacier ice thickness. Paleoglacier volumes certainly had a direct relationship with its accumulative area, but Slope can significantly impact its stability. Higher slopes are intrinsically linked with bed roughness, which applies a major control on an ice mass’s basal motion (Li et al., 2010). The higher slope values in the Caribbean basin can be related to the continuous orographic precipitation on the windward side which generates more erosion, as previously reported by Quesada-Román et al. (2020c). Rock surface weathering often leads to increased rock surface roughness, which is strongly linked with slope inclination (McCarrol and Nesje, 1996). Otherwise, the Pacific basin had larger paleoglaciers and lower slopes.
Paleoglacial ice thickness depends directly on its area, but Diurnal Anisotropic Heating accounted for differential warming on different aspects, which were important for spatial snow variability during the ablation season (Cristea et al., 2017). Moreover, more pronounced rain shadows probably generated topographic east-west asymmetry that strengthen the primary control on glacier ice thickness (Kessler et al., 2006). Paleoglaciers with broader thickness favored wind characteristics, such as wind direction (mostly from NE), velocity, seasonality and temperature, which can affect the processes that control ablation of glaciers, so there was a connection amid local wind fields and snow accumulation (Dadic et al., 2010). Local wind associated with the DAH dynamics possibly permeated the heat budget distribution thru air temperature variability, causing glacier fragmentation and impacts on mass balance during the LGM (Carturan et al., 2015).
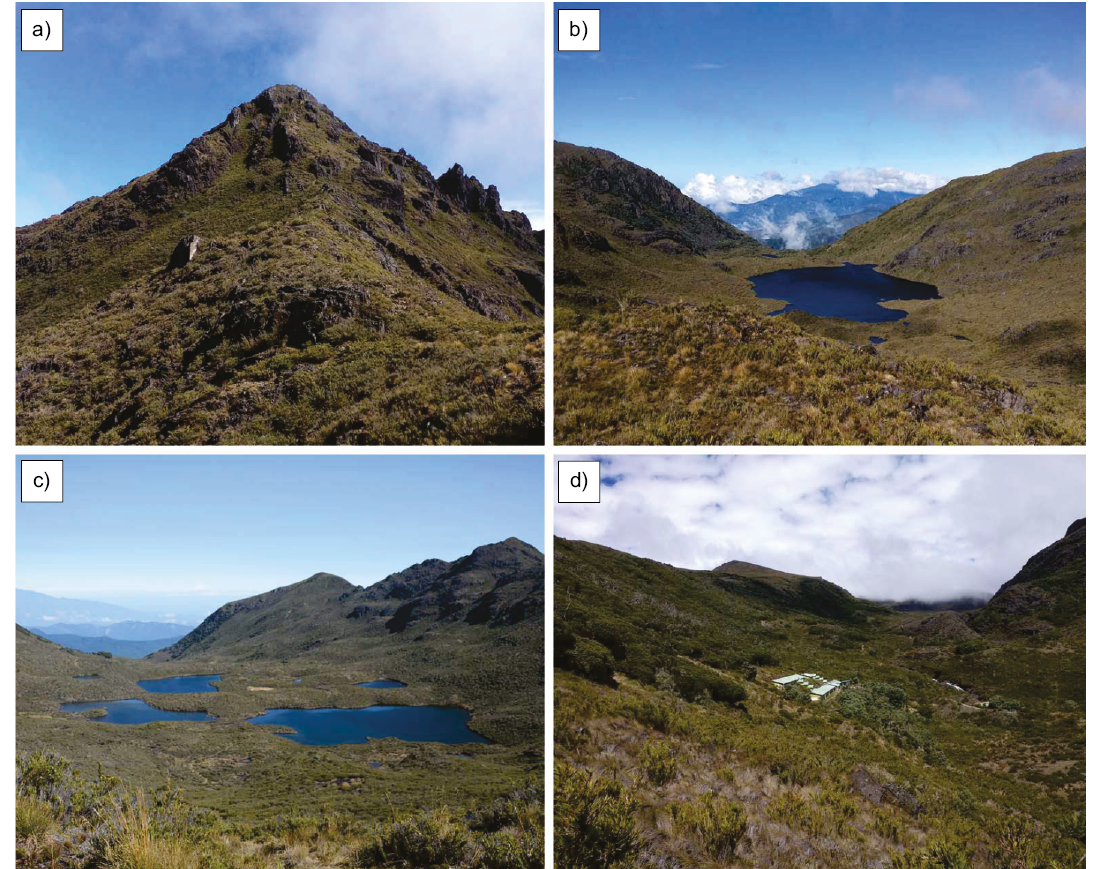
Figure 4. (a) Cerro Chirripó peak 3820 m a.s.l., (b) Lagos Chirripó (Pacific), (c) Valle Las Morrenas (Caribbean), (d) Valle Talari (Pacific).
Table 2. Parameters used to model paleoglacier areas.
|
Model terms |
Estimate |
Std. Error |
t value |
Pr(>|t|) |
|
|
(Intercept) |
-439.25 |
197.05 |
-2.229 |
0.034 |
* |
|
Area |
682.57 |
40.62 |
16.806 |
3.68E-16 |
*** |
|
Slope |
959.74 |
638.19 |
1.504 |
0.144 |
Note: Null deviance is 17587324 on 30° and residual deviance is 1461220 on 28° degrees of freedom, AIC is 429.55. Pr(>jzj) is the probability of finding the observed Z-ratio in the normal distribution of Z with a critical point of jzj. ***P=0.
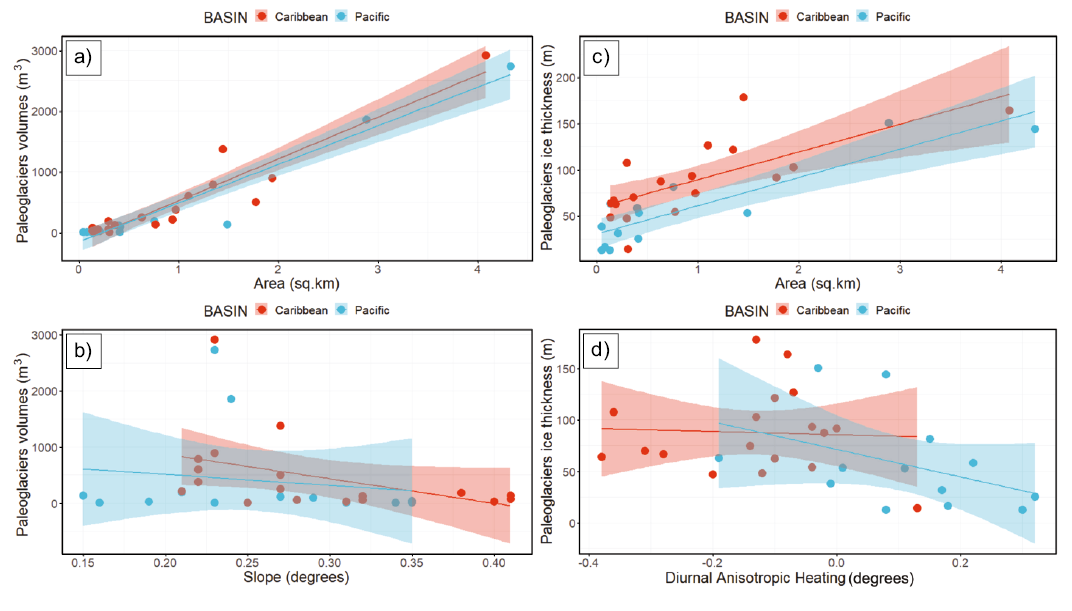
Figure 5. Relationship between paleoglacier volume and (a) Area, and (b) Slope, as well as paleoglacier ice thickness with Area (c) and Diurnal Anisotropic Heating (d), for the Caribbean (red) and Pacific (blue) basins.
Table 3. Parameters used to model paleoglacial ice thickness.
|
Model terms |
Estimate |
Std. Error |
t value |
Pr(>|t|) |
|
|
(Intercept) |
43.613 |
5.854 |
7.45 |
4.09E-08 |
*** |
|
Area |
30.803 |
4.082 |
7.547 |
3.21E-08 |
*** |
|
DAH |
-95.357 |
25.215 |
-3.782 |
0.000752 |
*** |
Note: Null deviance is 60659 on 30° df, residual deviance is 17157 on 27° df, and the AIC is 291.77. Pr(>jzj) is the probability of finding the observed Z-ratio in the normal distribution of Z with a critical point of jzj. ***P=0.
CONCLUSIONS
We completed the reconstruction of thirty-one paleoglacier volumes and ice thickness distribution in the highest summits of Costa Rica during the LGM. We found a maximum paleoglacier ice thickness of 178 meters in Cerro Chirripó and a total volume of 13862.768 × 105 (m3). The land surface parameters that had stronger relationships and better explained the paleoglacier volumes were Area and Slope, while for paleoglacier ice thickness the parameters were Area and Diurnal Anisotropic Heating. Our results agree with the projected climatic conditions that prevailed in the circum-Caribbean region through the LGM and with global sea surface temperature reconstructions. The synchronous effect of the LGM along the tropics also affected the surfaces over 3000 m in Costa Rica. We provide new insights into LGM activity in tropical high-altitude landscapes as one of the first paleoglacier volume and thickness reconstruction studies in the tropics. Glacier reconstructions not only provide valuable information on the past climatic dynamics in the tropics, but also are important assets to the country’s geoheritage in order to promote geotourism in the surrounding rural communities (Quesada-Román and Pérez-Umaña, 2020a, 2020b).
ACKNOWLEDGEMENTS
We are very glad to thank Russell Lee Losco for his helpful English revision. Also, we are grateful with the Editor-in-Chief, Peter Schaaf, and the anonymous reviewers for improving this study.
REFERENCES
Alfaro, A., Denyer, P., Alvarado, G.E., Gazel, E., Chamorro C., 2018, Estratigrafía y petrografía de las rocas ígneas en la Cordillera de Talamanca, Costa Rica: Revista Geológica de América Central, 58, 7-36, https://doi.org/10.15517/rgac.v58i0.32669
Alfaro, E., Quesada-Román, A., Solano, F.J., 2010, Análisis del impacto en Costa Rica de los ciclones tropicales ocurridos en el Mar Caribe desde 1968 al 2007: Revista Diálogos, 11(2), 25-38. https://doi.org/10.15517/dre.v11i2.578
Anderson, D.R., Burnham, K., 2004, Model selection and multi-model inference: New York, Springer-Verlag, 488 pp.
Annan, J.D, Hargreaves, J.C., 2015, A perspective on model-data surface temperature comparison at the Last Glacial Maximum: Quaternary Science Reviews, 107, 1-10, https://doi.org/10.1016/j.quascirev.2014.09.019
Barquero, J., Ellenberg, L., 1983, Geomorfología del piso alpino del Chirripó en la Cordillera de Talamanca, Costa Rica: Revista Geográfica de América Central, 17-18, 293-299.
Bergoeing, J.P., 1977, Modelado glaciar en la Cordillera de Talamanca, Costa Rica: Instituto Geográfico Nacional. Informe Semestral. Julio-Diciembre. 33-44.
Boehner, J., Antonic, O., 2009, Land Surface Parameters Specific to Topo-Climatology, in Hengl, T., Reuter, H.I. (eds.), Geomorphometry - Concepts, Software, Applications: Developments in Soil Science, 33, 195-226.
Camacho, M.E., Quesada-Román, A., Mata, R., Alvarado, A. 2020, Soil-geomorphology relationships of alluvial fans in Costa Rica: Geoderma Regional, 21, 1-12, e00258. https://doi.org/10.1016/j.geodrs.2020.e00258
Campos, N., Palacios, D., Tanarro, L.M., 2019, Glacier reconstruction of La Covacha Massif in Sierra de Gredos (central Spain) during the Last Glacial Maximum: Journal of Mountain Science, 16(6), 1336-1352, https://doi.org/10.1007/s11629-019-5382-2
Campos-Durán, D., Quesada-Román, A., 2017, Impacto de los eventos hidrometeorológicos en Costa Rica, periodo 2000-2015: Revista Geo UERJ, 30, 440-465. https://doi.org/10.12957/geouerj.2017.26116
Carr, S., Coleman, C., 2007, An improved technique for the reconstruction of former glacier mass-balance and dynamics: Geomorphology, 92(1-2), 76-90.
Carr, S.J., Lukas, S., Mills, S.C., 2010, Glacier reconstruction and mass‐balance modelling as a geomorphic and palaeoclimatic tool: Earth Surface Process and Landforms, 35(9), 1103-1115.
CARTA (Costa Rica Airborne Research and Technology Applications), 2005, Aerial photographs scale 1:25,000 of Costa Rica: National Aeronautics and Space Administration (USA) and Costa Rica Government, maps.
Carturan, L., Cazori, F., De Blasi, F., Dalla Fontana, G., 2015, Air temperature variability over three glaciers in the Ortles–Cevedale (Italian Alps): effects of glacier fragmentation, comparison of calculation methods, and impacts on mass balance modelling: The Cryosphere, 9(3), 1129-1146. https://doi.org/10.5194/tc-9-1129-2015
Chandler, B.M.P., Lovell, H., Boston, C.M., Lukas, S., Barr, I.D., Benediktsson, Í.Ö., Benn, D.I.,Clark, C.D., Darvill, C.M., Evans, D.J.A., Ewertowski, M.W., Loibl, D., Margold, M., Otto,J.-C., Roberts, D.H., Stokes, C.R., Storrar, R.D., Stroeven, A.P., 2018, Glacial geomorpho-logical mapping: a review of approaches and frameworks for best practice: Earth-Science Reviews, 185, 806-846, https://doi.org/10.1016/j.earscirev.2018.07.015
Chen, A.-A., Wang, N.-L., Guo, Z.-M., Wu, Y.-W., Wu, H.-B., 2018, Glacier variations and rising temperature in the Mt. Kenya since the Last Glacial Maximum: Journal of Mountain Science, 15, 1268-1282.
Clark, P.U., Dyke, A.S., Shakun, J.D., Carlson, A.E., Clark, J., Wohlfarth, B., Mitrovica, J.X., Hostetler, S.W., McCabe, A.M., 2009, The Last Glacial Maximum: Science, 325, 710-714. https://doi.org/10.1126/science.1172873
Conrad, O., Bechtel, B., Bock, M., Dietrich, H., Fischer, E., Gerlitz, L., Wehberg, J., Wichmann, V., Böhner, J., 2015, System for Automated Geoscientific Analyses (SAGA) v. 2.1.4: Geoscience Model Developments, 8, 1991-2007, https://doi.org/10.5194/gmd-8-1991-2015
Cristea, N.C., Breckheimer, I., Raleigh, M.S., HilleRisLambers, J., Lundquist, J.D., 2017, An evaluation of terrain-based downscaling of fractional snow covered area data setsbased on LiDAR-derived snow data and orthoimagery: Water Resourses Research, 53, https://doi.org/10.1002/2017WR020799
Cunningham, M., Stark, C.P., Kaplan, M., Schaefer, J., 2019, Glacial limitation of tropical mountain height: Earth Surface Dynamics, 7, 147-169, https://doi.org/10.5194/esurf-7-147-2019
Dadic, R., Mott, R., Lehning, M., Burlando, P., 2010, Wind influence on snow depth distribution and acumulation over glacials: Journal of Geophysical Research, 115, 1-8, https://doi.org/10.1029/2009JF001261
DeMets, C., Gordon, R.G., Argus, D.F., 2010, Geologically current plate motions: Geophysical Journal International, 181, 1-80, https://doi.org/10.1111/j.1365-246X.2009.04491.x
Escobar, J., Hodell, D. A., Brenne, R, M., Curtis, J. H., Gilli, A., Mueller, A. D., Anselmetti, F. S., Ariztegui, A., Grzesik,, D. A., Pérez, L., Schwalb, A., Guilderson, T. P., 2012, A ∼43-ka record of paleoenvironmental change in the Central American lowlands inferred from stable isotopes of lacustrine ostracods: Quaternary Science Reviews, 37, 92-104.
Esquivel-Hernández, G., Sánchez-Murillo, R., Quesada-Román, A., Mosquera, G.M., Birkel, C., Boll, J., 2018, Insight into the stable isotopic composition of glacial lakes in a tropical alpine ecosystem: Chirripó, Costa Rica: Hydrological Processes, 32(24), 3588-3603. https://doi.org/10.1002/hyp.13286
Esquivel-Hernández, G., Mosquera, G.M., Sánchez-Murillo, R., Quesada-Román, A., Birkel, C., Crespo, P., Célleri, R., Windhorst, D., Breuer, L., Boll, J., 2019, Moisture transport and seasonal variations in the stable isotopic composition of rainfall in Central American and Andean Páramo during El Niño conditions (2015-2016): Hydrological Processes, 33(13), 1802-1817, https://doi.org/10.1002/hyp.13438
Favier, V., Wagnon, P., Ribstein, P., 2004, Glaciers of the outer and inner tropics: adifferent behavior but a common response to climatic forcing: Geophysical Research Letters, 31, L16403.
Ganeshram, R.S., Pedersen, T.F., Calvert, S.E., McNeill, G.W., Fontugne, M.R., 2000, Glacial‐interglacial variability in denitrification in the world's oceans: Causes and consequences: Paleoceanography, 15(4), 361-376.
Gardner, T.W., Fisher, D.M., Morell, K.D., Cupper, M.L., 2013, Upper-plate deformation in response to flat slab subduction inboard of the aseismic Cocos Ridge, Osa Peninsula, Costa Rica: Lithosphere, 5(3), 247-264. https://doi.org/10.1130/L251.1
Hastenrath, S., 1973, On the Pleistocene glaciation of the Cordillera de Talamanca, Costa Rica: Zeitschrift für Gletscherkunde und Glazialgeologie, 9(1-2), 105-121.
Hodell, D.A., Anselmetti, F.S., Ariztegui D., Brenner M., Curtis J.H., Gilli, A., Grzesi K,D.A., Guilderson T.J., Müller, A.D., Bush M.B., Correa-Metrio A., Escobar, J., Kutterolf, S., 2008, An 85-ka record of climate change in lowland Central America: Quaternary Science Reviews, 27(11–12), 1152-1165.
IMN (Instituto Meteorológico Nacional), 2009, Chirripó Meteorological Station Data, https://www.imn.ac.cr/.
Islebe, G.A., Hooghiemstra, H., 1997, Vegetation and climate history of montane Costa Rica since the last glacial: Quaternary Science Reviews, 16(6), 589-604, https://doi.org/10.1016/S0277-3791(96)00051-0
Jackson, M.S, Kelly, M.A., Russell, J.M., Doughty, A.M., Howley, J.A., Chipman, J.W., Cavagnaro, D., Nakileza, B., Zimmerman, S.R.H., 2019, High-latitude warming initiated the onset of the last deglaciation in the tropics: Science Advances, 5(12), eaaw2610.
Kessler, M.A, Anderson, R.S, Stock, G.M., 2006, Modeling topographic and climatic control of east-west asymmetry in Sierra Nevada glacier length during the Last Glacial Maximum: Journal of Geophysical Research, Earth Surface, 111(F2).
Lachniet, M.S., Roy, A.J., 2011, Costa Rica and Guatemala, in Ehlers, J., Gibbard, P.L., Hughes P.D. (eds.), Quaternary Glaciations - Extent and Chronology. A closer look: Developments in Quaternary Science, 15, Elsevier, Amsterdam, 843-858.
Lachniet, M.S., Seltzer, G.O., 2002, Late Quaternary glaciation of Costa Rica: Bulletin of Geological Society of America, 114(5), 547-558.
Lachniet, M.S., Vázquez-Selem, L., 2005, Last Glacial Maximum equilibrium line altitudes in the circum-Caribbean (Mexico, Guatemala, Costa Rica, Colombia, and Venezuela): Quaternary International, 138-139, 129-144, https://doi.org/10.1016/j.quaint.2005.02.010
Lachniet, M.S., Johnson, L., Asmerom, Y., Burns, S.J., Polyak, V., Patterson, W.P., Burt, L., Azouz, A., 2009, Late Quaternary moisture export across Central America and to Greenland: Evidence for tropical rainfall variability from Costa Rican stalagmites: Quaternary Science Reviews, 28, 3348-3360.
Lachniet, M.S., Asmerom, Y., Bernal, J.P., Polyak, V.J., Vázquez Selem, L., 2013, Orbital pacing and ocean circulation-induced collapses of the Mesoamerican monsoon over the past 22,000 y: Proceedings of the National Academy of Sciences, 110(23), 9255-9260. https://doi.org/10.1073/pnas.1222804110
Li, X., Sun, B., Siegert, M.J., Bingham, R. G., Tang, X., Zhang, D.., Cui, X., Zhang, X., 2010, Characterization of subglacial landscapes by a two-parameter roughness index: Journal of Glaciology, 56(199), 831-836, https://doi.org/10.3189/002214310794457326
Li, Y., Tieche, T., Horn, S.P., Li, Y., Chen, R., Orvis, K.H., 2019, Mapping glacial landforms on the Chirripó massif, Costa Rica, based on Google Earth, a digital elevation model, and field observations: Revista Geológica de América Central, 60, 101-114.
Loomis, S.E., Russell, J.M., Verschuren, D., Morrill, C., De Cort, G., Damsté, J.S.S., Olago, D., Eggermont, H., Street-Perrott, F.A., Kelly, M.A., 2017, The tropical lapse rate steepened during the Last Glacial Maximum: Science Advances, 3(1), e1600815.
Maldonado, T., Rutgersson, A., Alfaro, E., Amador, J., Claremar, B., 2016, Interannual variability of the midsummer drought in Central America and the connection with sea surface temperatures: Advances in Geosciences, 42, 35-50, https://doi.org/10.5194/adgeo-42-35-2016
Mark, B.G., Harrison, S.P., Spessa, A., New, M., Evans, D.J., Helmens, K.F., 2005, Tropical snowline changes at the last glacial maximum: A global assessment: Quaternary International, 138-139, 168-201, https://doi.org/10.1016/j.quaint.2005.02.012
McCarrol, D., Nesje, A., 1996, Rock surface roughness as an indicator of degree of rock surface weathering: Earth Surface Processes and Landforms, 21, 963-977.
Méndez, M., Calvo-Valverde, L.A., Maathuis, B., Alvarado-Gamboa, L.F., 2019, Generation of Monthly Precipitation Climatologies for Costa Rica Using Irregular Rain-Gauge Observational Networks: Water, 11(1), 70, https://doi.org/10.3390/w11010070
Mölg, T., Hardy, D., Cullen, N., Kaser, G., 2008, Tropical Glaciers, climate change, and society: Focus on Kilimanjaro (East Africa), in Orlove, B., Wiegnadt, E., Luckman, B.H. (eds.), The Darkening Peaks: Glacial Retreat in Scientific and Social Context: University of California Press, 168-182.
Morell, K.D., Kirby, E., Fisher, D.M., Soest, M., 2012, Geomorphic and exhumational response of the Central American Volcanic Arc to Cocos Ridge subduction: Journal of Geophysical Research: Solid Earth, 117, 1-23, https://doi.org/10.1029/2011JB008969
Orvis, K.H., Horn, S.P., 2000, Quaternary Glaciers and Climate on Cerro Chirripó, Costa Rica: Quaternary Research, 54(1), 24-37. https://doi.org/10.1006/qres.2000.2142
Osmaston, H., 2005, Estimates of glacier equilibrium line altitudes by the Area x Altitude, the Area x Altitude Balance Ratio and the Area x Altitude Balance Index methods and their validation: Quaternary International, 138-139, 22-31, https://doi.org/10.1016/j.quaint.2005.02.004
Osmaston, H., Harrison, S.P., 2005, The Late Quaternary glaciation of Africa: A regional synthesis: Quaternary International, 138-139, 32-54, https://doi.org/10.1016/j.quaint.2005.02.005
Oster, J.L., Warken, S.F., Sekhon, N., Arienzo, M.M., Lachniet,M., 2019, Speleothem paleoclimatology for the Caribbean, Central America, and North America: Quaternary, 2(5), 33, https://doi.org/10.3390/quat201000
Palacios, D., Stokes, C.R., Phillips, F.M., Clague, J.J., Alcalá-Reygosa, J., Andres, N., Angel, I., Blard, P.-H., Briner, J.P., Hall, B.L., 2020, The deglaciation of theAmericas during the Last Glacial Termination: Earth-Science Reviews, 203, 103113, https://doi.org/10.1016/j.earscirev.2020.103113
Pearce, D.M., Ely, J.C., Barr, I.D., Boston, C.M., 2017, Glacier Reconstruction, in Cook, S., Clarke, L., Nield, J. (eds), Geomorphological Techniques: British Society for Geomorphology. Chap. 3, Sec. 4.9. pp. 16.
Porter, S.C., 2000, Snowline depression in the tropics during the Last Glaciation: Quaternary Science Reviews, 20(10), 1067-1091.
Porter, S.C., 2001, Snowline depression in the tropics during the last glaciation: Quaternary Science Reviews, 20(10), 1067-1091.
Potter, R.S., Li, Y., Horn, S.P., Orvis, K.H., 2019, Cosmogenic Cl-36 surface exposure dating of late Quaternary glacial events in the Cordillera de Talamanca, Costa Rica: Quaternary Research, 92(1), 216-231, https://doi.org/10.1017/qua.2018.133
Quesada-Román, A., 2016, Peligros geomorfológicos: inundaciones y procesos de ladera en la cuenca alta del río General (Pérez Zeledón), Costa Rica: Mexico, Universidad Nacional Autónoma de México, Posgrado en Geografía, Maestría en Geografía con énfasis en Geografía Ambiental, 157 pp.
Quesada-Román, A., 2017, Geomorfología Fluvial e Inundaciones en la Cuenca Alta del Río General, Costa Rica: Anuário do Instituto de Geociencias, 40(2), 278-288, https://doi.org/10.11137/2017_2_278_288
Quesada-Román, A., Pérez-Briceño, P.M, 2019, Geomorphology of the Caribbean coast of Costa Rica: Journal of Maps, 15(2), 363-371, https://doi.org/10.1080/17445647.2019.1600592
Quesada-Román, A., Zamorano-Orozco, J.J., 2019a, Geomorphology of the Upper General River Basin, Costa Rica: Journal of Maps 15(2), 95-101, https://doi.org/10.1080/17445647.2018.1548384
Quesada-Román, A., Zamorano-Orozco, J.J., 2019b, Zonificación de procesos de ladera e inundaciones a partir de un análisis morfométrico en la cuenca alta del río General, Costa Rica: Investigaciones Geográficas, 99, 1-19, http://dx.doi.org/10.14350/rig.59843
Quesada-Román, A., Stoffel, M., Ballesteros-Cánovas, J.A., Zamorano-Orozco, J.J., 2019, Glacial geomorphology of the Chirripó National Park, Costa Rica: Journal of Maps, 15(2), 538-545, https://doi.org/10.1080/17445647.2019.1625822.
Quesada-Román, A., Pérez-Umaña, D., 2020a, State of the art of geodiversity, geoconservation and geotourism in Costa Rica: Geosciences, 10(6), 211, https://doi.org/10.3390/geosciences10060211
Quesada-Román, A., Pérez-Umaña, D., 2020b, Tropical paleoglacial geoheritage inventory for geotourism management of Chirripó National Park, Costa Rica: Geoheritage, 12, 58, https://doi.org/10.1007/s12371-020-00485-0
Quesada-Román, A., Ballesteros-Cánovas, J.A, Granados-Bolaños, S., Birkel, C., Stoffel, M., 2020a, Dendrogeomorphic reconstruction of floods in a dynamic tropical river: Geomorphology, 359, 107133, https://doi.org/10.1016/j.geomorph.2020.107133
Quesada-Román, A., Ballesteros-Cánovas, J.A., Guillet S., Madrigal-González, J., Stoffel, M., 2020b, Neotropical Hypericum irazuense shrubs reveal recent ENSO variability in Costa Rican páramo: Dendrochronologia, 61, 125704, https://doi.org/10.1016/j.dendro.2020.125704
Quesada-Román, A., Campos, N., Alcalá-Reygosa, J., Granados-Bolaños, S., 2020c, Equilibrium-line altitude and temperature reconstructions during the Last Glacial Maximum in Chirripó National Park, Costa Rica: Journal of South American Earth Sciences, 100, 102576, https://doi.org/10.1016/j.jsames.2020.102576
Rea, B.R., 2009, Defining modern day Area-Altitude Balance Ratios (AABRs) and their use in glacier-climate reconstructions: Quaternary Science Reviews, 28, 237-248, https://doi.org/10.1016/j.quascirev.2008.10.011
Riley, S.J., De Gloria, S.D., Elliot, R., 1999, A Terrain Ruggedness that Quantifies Topographic Heterogeneity: Intermountain Journal of Sciences, 5(1-4), 23-27.
Roy, A.J., Lachniet, M.S., 2010, Late Quaternary glaciation and equilibrium-line altitudes of the Mayan Ice Cap, Guatemala, Central America: Quaternary Research, 74(1), 1-7, https://doi.org/10.1016/j.yqres.2010.04.010
Sofia, G., 2020, Combining geomorphometry, feature extraction techniques and Earth-surface processes research: The way forward: Geomorphology, 355, 107055, https://doi.org/10.1016/j.geomorph.2020.107055
Stansell, N.D., Polissar, P.J., Abbott, M.B., 2007, Last glacial maximum equilibrium-line altitude and paleo-temperature reconstructions for the Cordillera de Mérida, Venezuelan Andes: Quaternary Research, 67(1), 115-127.
Tarini, M., Cignoni, P., Montani, C., 2006, Ambient Occlusion and Edge Cueing to Enhance Real Time Molecular Visualization: IEEE Transactions on Visualization and Computer Graphics, 12(5), 1237-1244.
Vázquez-Selem, L., Lachniet, M.S. 2017, The deglaciation of the mountains of Mexico and Central America: Cuadernos de Investigación Geográfica, 43(2), 553-570, https://doi.org/10.18172/cig.3238
Veas-Ayala, N., Quesada-Román, A., Hidalgo, H., Alfaro, E., 2018, Humedales del Parque Nacional Chirripó, Costa Rica: características, relaciones geomorfológicas y escenarios de cambio climático: Revista de Biología Tropical 66(4), 1436-1448, https://doi.org/10.15517/rbt.v66i4.31477
Vinod, H.D. 2017, Generalized correlation and kernel causality with applications in development economics. Communications in Statistics-Simulation and Computation, 46(6), 4513-4534.
Waylen, P., Laporte, S., 1999, Flooding and the El Niño‐Southern Oscillation phenomenon along the Pacific coast of Costa Rica: Hydrological Processes, 13(16), 2623-2638.
Weyl, R, 1955, Contribución a la geología de la Cordillera de Talamanca. Instituto Geográfico Nacional: San José, Costa Rica, 77 pp.